Developer-facing visualizer for the finger-tree backing any immutables
structure (flexseq, ordered_sequence, priority_queue,
interval_index). The S3 plot() methods on those classes forward to
this function, but plot_structure() is also callable directly and gives
access to the full node_label API for custom label formatting. Requires
the igraph package (listed in Suggests).
Usage
plot_structure(
  t1,
  vertex.size = 15,
  vertex.shape = "rounded_rect",
  edge.width = 1,
  label_edges = FALSE,
  title = NULL,
  node_label = "value",
  label.cex = NULL,
  asp = NA,
  legend = TRUE,
  ...
)
Arguments
- t1
A finger-tree-backed immutables structure.
- vertex.size
Passed to
igraph::plot.igraph. Ignored by the default"rounded_rect"shape, which sizes each box to its own label text.- vertex.shape
Vertex shape. Defaults to
"rounded_rect", a custom shape registered on first call that auto-sizes every box to fit its label (so multi-line labels render cleanly without tuningvertex.size). Any built-in igraph shape ("circle","rectangle","none", ...) also works and is passed through unchanged.- edge.width
Edge width passed to
igraph::plot.igraph.- label_edges
If
TRUE, draw the child slot name on each edge ("prefix"/"middle"/"suffix"forDeepnodes, or the numeric position forDigit/Node2/Node3).- title
Optional plot title.
- node_label
Either one of the preset modes
"value"(default; payload for elements, blank for structural),"type"(node class name),"both"(type + value on separate lines),"none", or a user-supplied functionfunction(node)returning a single character string per vertex. Thenodeargument is a list with fields:idInternal graph vertex id (string).
typeNode class:
"Element","Digit","Deep","Node2","Node3","Single", or"Empty".labelThe default label string.
measuresNamed list of accumulated monoid values for the subtree rooted at this node. For structural nodes these are the cached values; for element leaves, each entry is the monoid's
measure()applied to the leaf entry. Keys include built-ins (.size,.named_count, and any structure-specific ones like.pq_min) plus any custom name added viaadd_monoids().elementFor element nodes, the raw leaf entry. Shape depends on the structure type; see
measure_monoid()for the entry contract.NULLfor structural nodes.
Measure values are exposed as-is, including list-valued measures (e.g. the built-in
.pq_minislist(has, priority)).- label.cex
Numeric scalar controlling label text size (passed as
vertex.label.cexto igraph). IfNULL(default), scales automatically from ~1.0 on small trees down to ~0.55 on dense ones so the auto-sized"rounded_rect"boxes don't collide. Override with a fixed value for finer control.- asp
Plot aspect ratio (physical y-unit / physical x-unit). Default
NAlets the tree fill the device without aspect constraint. Set to a numeric (e.g.0.4) to enforce horizontal stretching, or1for a square plot region.- legend
If
TRUE(default), draws a horizontal legend below the tree mapping node-type names to their fill colors, restricted to types actually present.- ...
Additional arguments passed to
igraph::plot.igraph(e.g.vertex.label.color,vertex.frame.color).
Examples
if (requireNamespace("igraph", quietly = TRUE)) {
# \donttest{
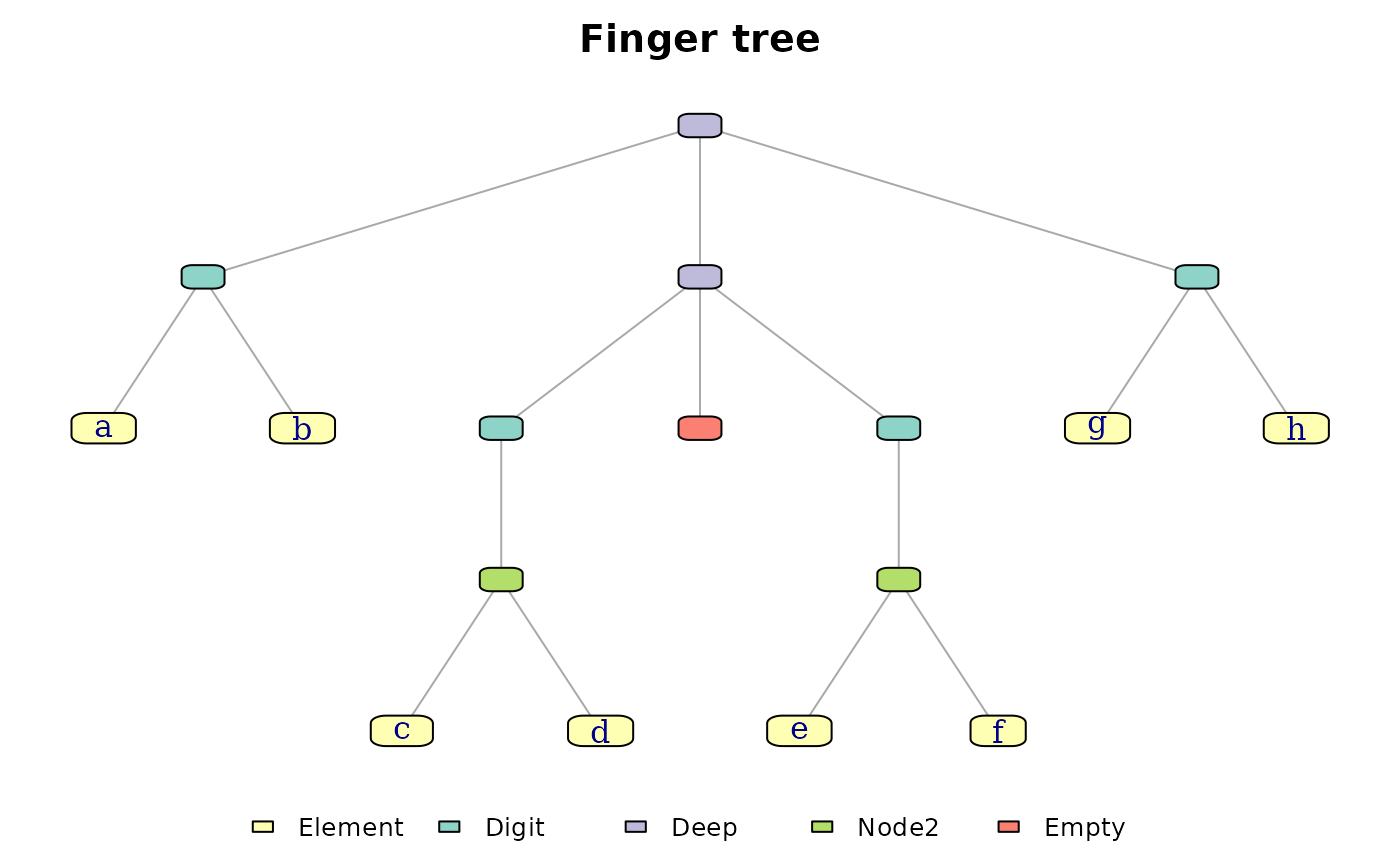
t <- as_flexseq(letters[1:8])
plot_structure(t, title = "Finger tree")
# Label every node with its subtree size (leaves contribute 1).
plot_structure(as_flexseq(1:10), node_label = function(node) {
paste0(node$type, "\n.size=", node$measures$.size)
})
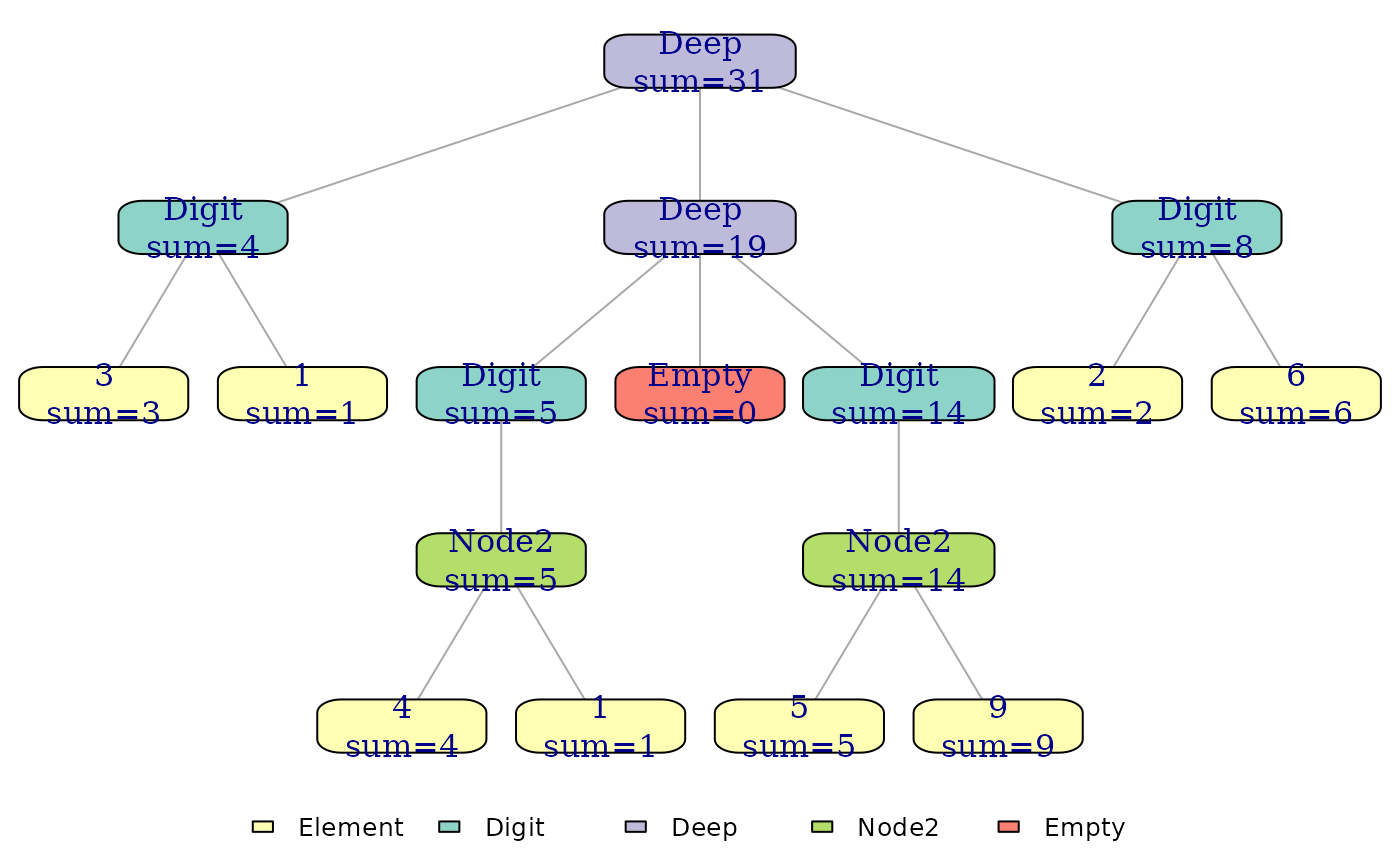
# Custom monoid: subtree sum of numeric payloads. Structural nodes show
# the accumulated total; leaves show their own contribution.
sum_monoid <- measure_monoid(`+`, 0, function(el) el)
xs <- add_monoids(as_flexseq(c(3, 1, 4, 1, 5, 9, 2, 6)),
list(sum = sum_monoid))
plot_structure(xs, node_label = function(node) {
if(node$type == "Element") sprintf("%g\nsum=%g", node$element, node$measures$sum)
else sprintf("%s\nsum=%g", node$type, node$measures$sum)
})
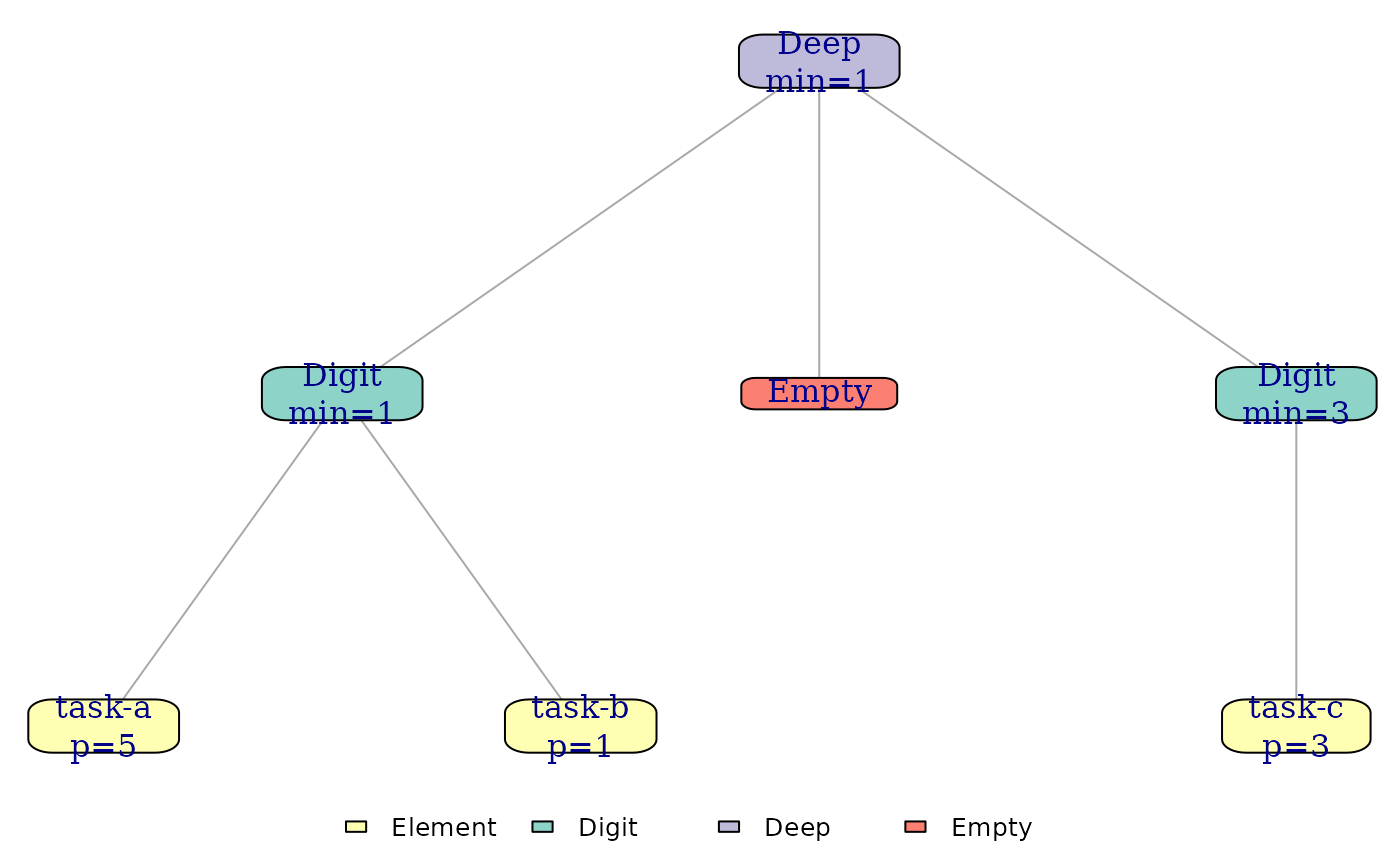
# List-valued built-in measure: priority_queue's .pq_min tracks the min
# priority seen in a subtree as list(has, priority). Unpack in the label.
pq <- priority_queue("task-a", "task-b", "task-c",
priorities = c(5, 1, 3))
plot_structure(pq, node_label = function(node) {
m <- node$measures$.pq_min
if(node$type == "Element") {
sprintf("%s\np=%g", node$element$value, node$element$priority)
} else if(isTRUE(m$has)) {
sprintf("%s\nmin=%g", node$type, m$priority)
} else {
node$type
}
})
# }
}